
The right colors

Finding the right frequency of color variation for a complex data visualization palette

The challenge

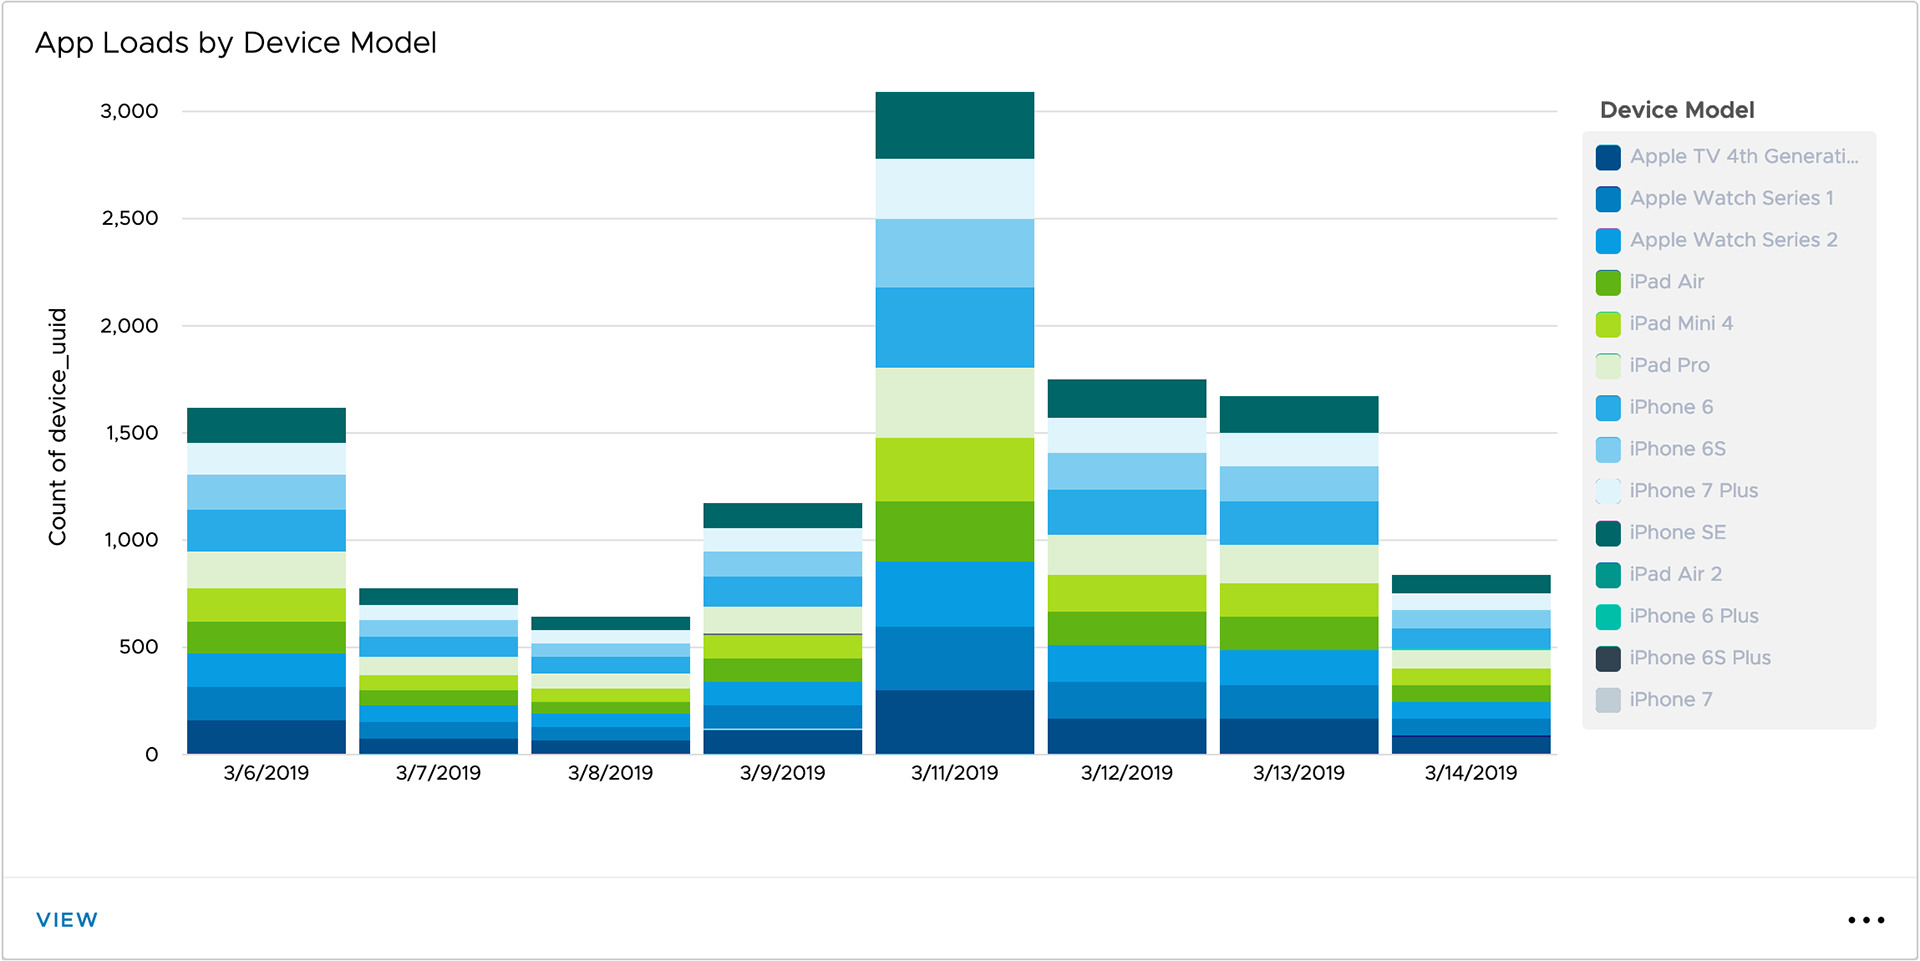
The existing color sequence for data visualization in the Intelligence Console does not reflect appropriate colors that tie the VMWare brand with the product and falls short for the average data points needed in charts. The direct impact of this change will be seen all over the product suite as the majority of it is chart-driven.

Color Palette

The current Clarity color palette was selected to do a color exploration that would satisfy the demand to include between 20 and 25 color swatches to accommodate for charts and data visualizations with as many data points was defined.
The initial exploration was done by selecting colors with an accessibility rate of at least AA or 4.1:1 ratio and then removing anything with pre-existing meaning (links and alerts).

Working Color Palette

After removing the colors that didn’t pass the AA rating, and removing the colors that had previous meaning, what was left was a color palette that was unusable when it came time to draw different color sequences.
The decision was made to extend the existing Clarity Palette tweaking hue and saturation values to accommodate for the current ask and then explore possible sequences for contrast and accessibility.

Sequence Testing

With a working palette in place, it was time to test different sequences to get the right one. There were over 15 sequences tested using different methods, these were the final three.

Sequence Testing, a lot of it…

With over 15 sequences tested, we settled finally on one and made it work.

The result

The outcome was a bright-colored palette that represents the brand properly, has been thoroughly tested for accessibility, and has the right sequence to differentiate all data points in the most complex of data visualization forms in the platform.
Final sequence

Let’s Discuss Your Next Project